Decompressing Eiger and Pilatus data
These detectors write data compressed with the bitshuffle algorithm. There are various ways of installing the required decompression filters, but the recommended way is to work within a conda environment, for which the MAX IV conda channel provides the necessary Linux packages. Data can then be browsed as above and visualized as below.
conda config --add channels maxiv
conda install bitshuffle
For windows and mac, use the hdf5plugin module. The most convenient way is to use Anaconda, in which the following command installs the necessary package.
conda install -c conda-forge hdf5plugin
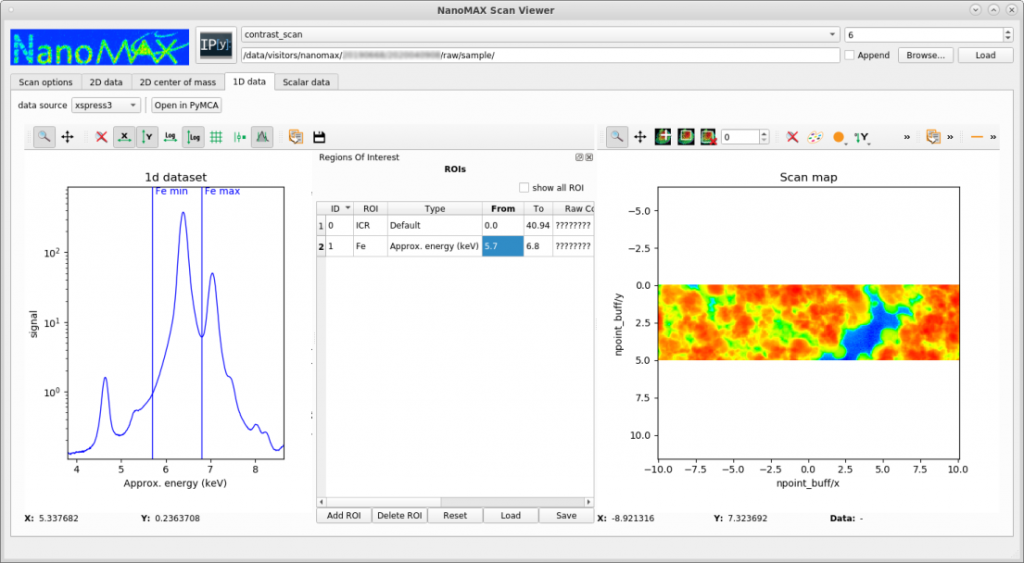
Basic experimental data visualization
NanoMAX provides a basic tool for quickly visualizing scanning data, such as XRF or diffraction mapping. The tool is not designed for quantitative fitting, but for generating fast overviews and evalutating ongoing experiments. The tool (called scanViewer) can be downloaded here. It is only developed and tested on Linux, but users have reported using it successfully with Mac and Windows. In the following example, a region of interest of a fluorsscence emission spectrum is selected, and the intensity in this region is mapped out across the sample.
Fluorescence image data analysis
We normally use the software PyMCA developed at ESRF for fluorescence imaging data analysis. XRF image analysis can be a bit tricky in the beginning and therefore some assistance can be found in this step-by-step guide describing how to load and fit NanoMAX X-ray fluorescence data with PyMCA.