The page describes some of the graphical interfaces and tools users will encounter at Balder. Only a limited amount of information is provided here for the benefit of prospective/first-time users. Comprehensive information and troubleshooting guides are available in the internal Balder Wiki page (needs an active VPN connection).
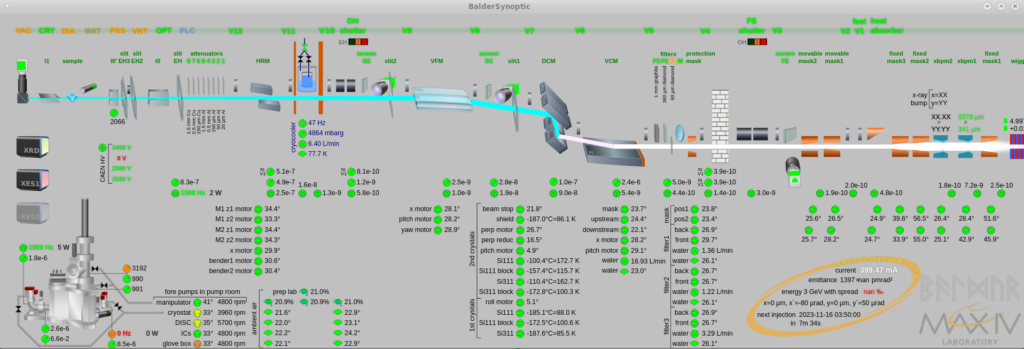
Balder Synoptic
The synoptic provides a schematic layout of the beamline with an overview of the current settings and clickable buttons for operations such as opening/closing valves and shutters.
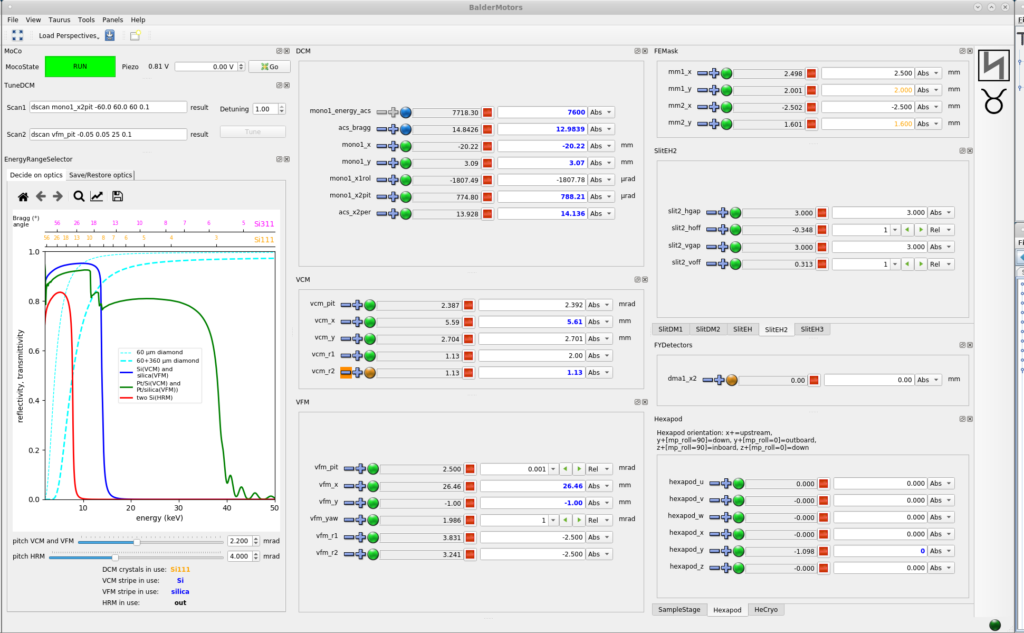
Motor GUI
BalderMotors GUI is started using the command <BalderMotors> in a terminal window. On the top left hand corner is the MoCo widget which keeps the beam position constant during energy scans. Some motors which are commonly used for most experiments are those belonging to DCM (double crystal monochromator) and various sample manipulators: Sample Stage, Hexapod, He Cryo. The motor panels are dockable widgets and are customized for every experiment.
Scan GUI
The Scan GUI can be started with the command <BalderScans> in a terminal window. This window contains the widgets for configuring and performing scans and observing live data during the measurement (including the extracted XAFS).
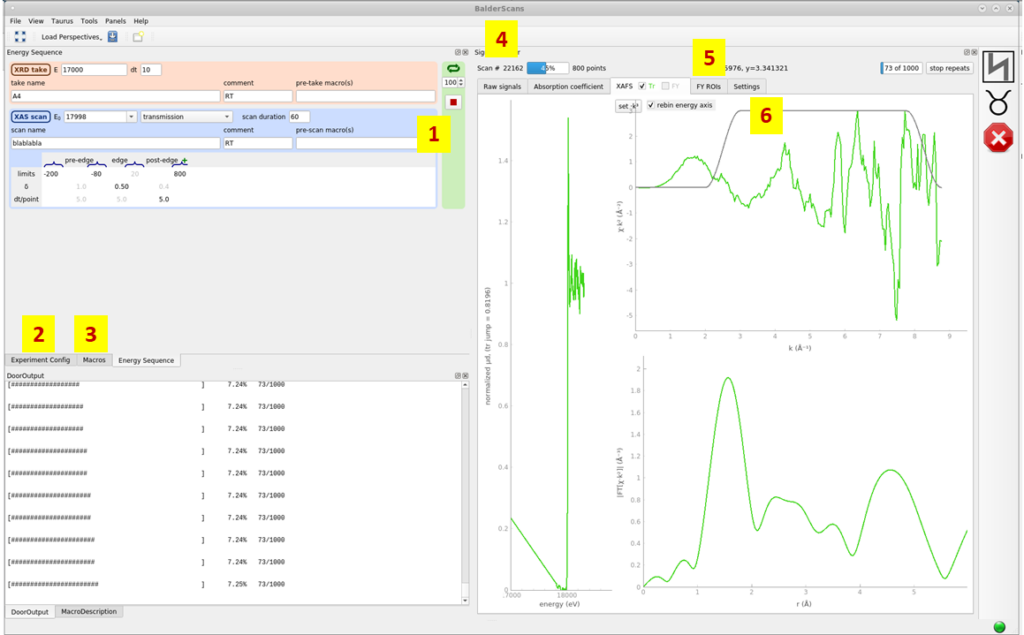
Some of the common tasks which are done using this GUI are described below and the tabs corresponding to these are labeled in the figure.
- Energy sequence/scan list: The sequence of XAS, XRD, XRF scans are built using this widget. Filename, parameters (edge energy, intervals, duration etc) corresponding to every measurement and the number of repetitions of this sequence are also defined here.
- Experiment Config: Data directory and master file-name, measurement groups (set of detectors that need to acquire data during the scans) are selected in this tab.
- Macros: Regular sardana macros can be run from this tab. These include are scans of the sample stages, beamline motors etc. and macros related to energy calibration and conditioning of certain devices/servers.
- Scan number: The scan number is visible on the top-left corner of the plotting widget. This number is appended to all the raw data and on-the-fly reduced data files.
- FY ROIs: Fluorescence yield when measured using MCAs have 1k channels. This tab enables one to select the region corresponding to the relevant fluorescence line (like Kα) and sum up the counts within a certain region of interest (ROI). The integrated counts within ROIs are then plotted in the live-view and stored in data files.
- Settings: The channels corresponding to I0, I1, integration time (in case of fluorescence yield) etc for both live plotting and data extraction are selected in this tab.
AlbaEM Web Interface
Currents from the ionization chambers and diodes are measured at Balder using two Alba electrometers (AEMs). Typically, channels 1 and 2 of AEM-1 are used for I0 and channels 3 and 4 of AEM-2 are used for I1.
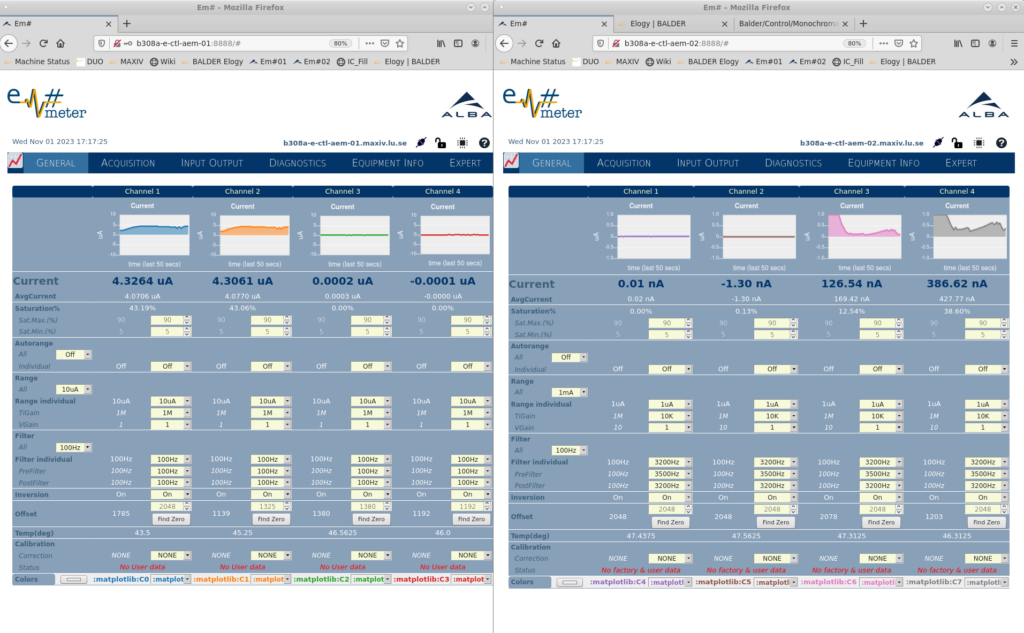
The range settings are chosen manually for every channel based on the observed readings and should be monitored periodically during the experiment.
OrthoView
OrthoView serves the dual purpose of a sample viewer and a clickable positioner for flat samples. The beam position is calibrated using X-ray induced optical luminescence from a diamond window prior to the start of every beamtime and the screen coordinates are calibrated to the motor positions (mp_x for horizontal motion and mp_y for vertical motion) to create a clickable sample positioner.
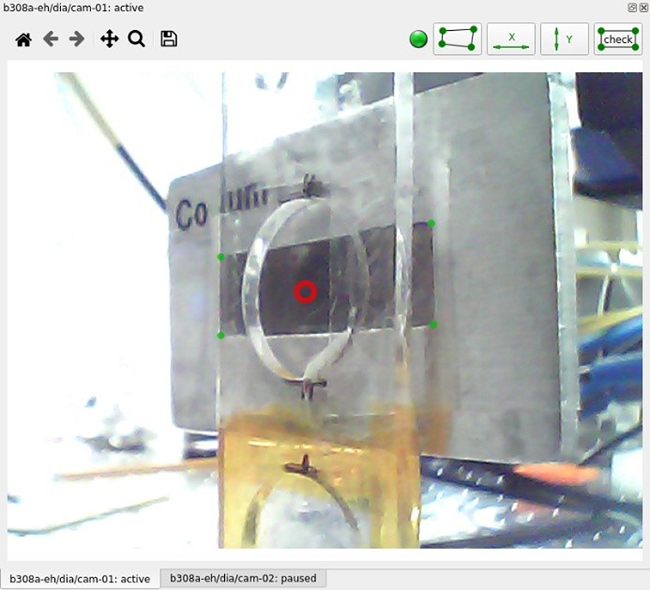
The figure above shows the original view as seen by the camera. The red circle in the center specifies the beam position on the sample. The user defines four corners of a rectangle with horizontal and vertical sides and specifies its sizes to calibrate the screen.
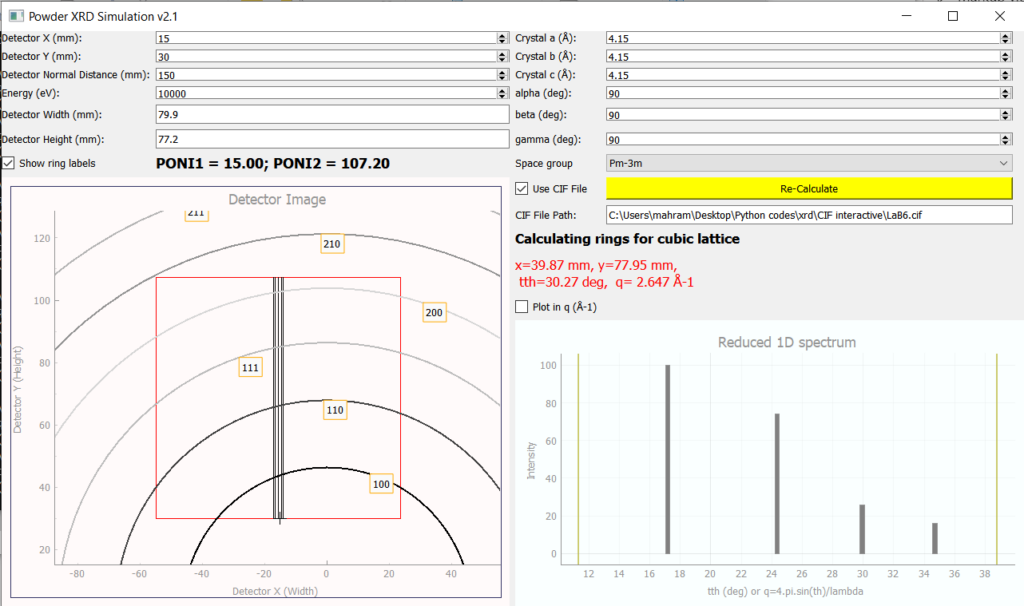
XRD Simulation tool
At Balder, the XRD detector is positioned manually based on constraints like the q-range of interest, accessible energy range and sample environment in use, which are specific for every experiment. Hence, the detector is positioned and calibrated prior to the experiment (using a standard such as LaB6) and kept fixed for the entire duration of the experiment. In order to choose an optimal position, a graphical simulation tool is provided. It is possible to simulate the powder ring positions (without intensities) using the crystallographic parameters or obtain the positions and intensities by providing a CIF of the sample.
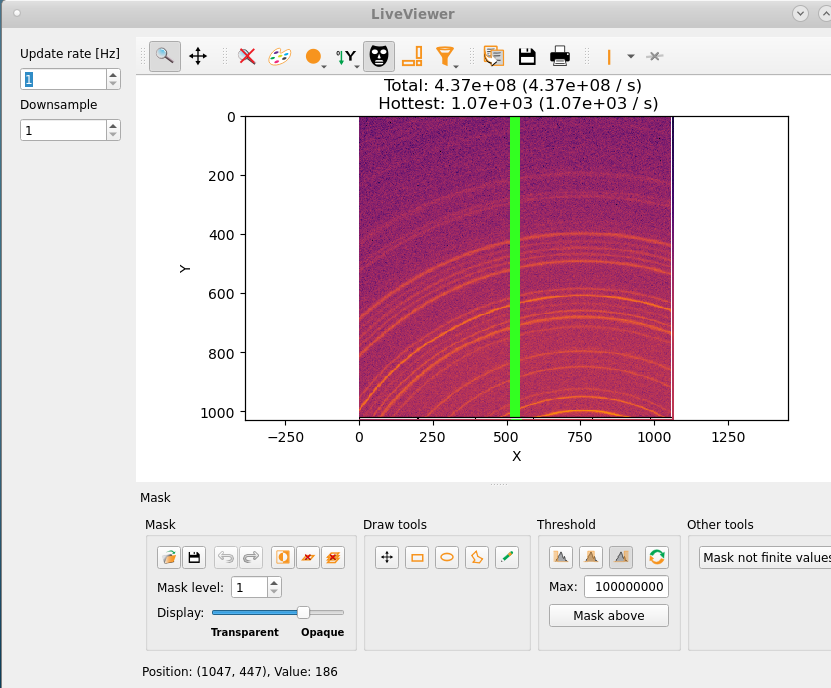
XRD Live Viewer and Azimuthal Integration Pipeline
The live viewer is a Qt-Silx GUI which shows the 2D EIGER patterns. One can set either a fixed mask or a threshold to blank out hot (overflow) pixels and also customize the plotting range and color schemes.
The on-the-fly reduction pipeline performs azimuthal integration of the 2D data (based on azint script) for a fixed detector setting which is defined in a given PONI file. The PONI file can be generated in a number of ways, for example, using the graphical tool provided as a part of the PyFAI package. One need to choose the radial unit (q or 2θ) prior to starting the pipeline and the reduced data files corresponding to every scan number is created in the location /process/azint within the data directory.
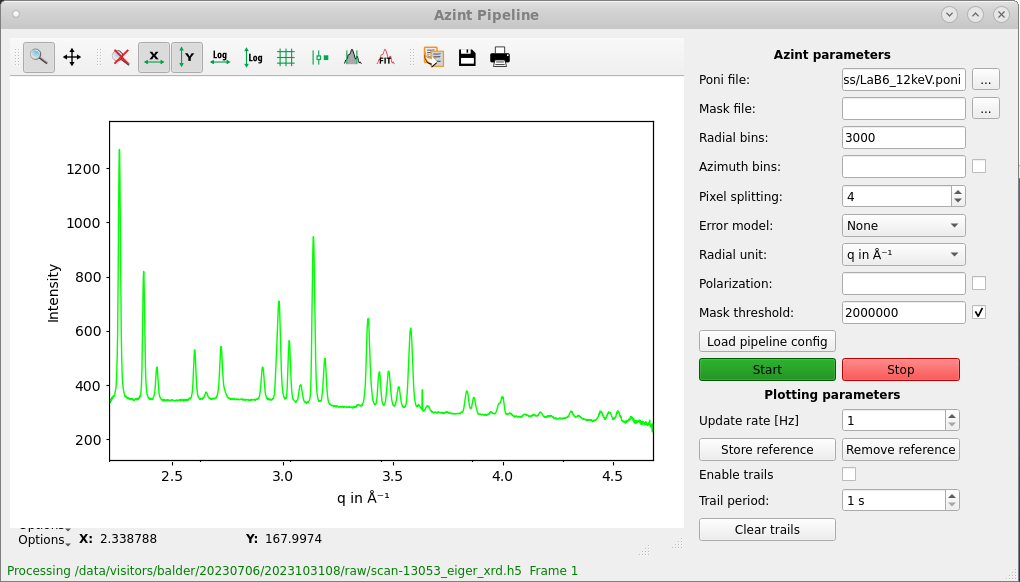
(Tip: The pipeline assumes the value of the wavelength provided in the PONI file for azimuthal integration. This may not be valid at Balder since, due to a fixed detector position during an experiment, we typically measure XRD patterns at different energies to obtain information from different q-regions. In these situations, it is recommended to use 2θ as the radial axis during integration.)