The first data set collected with the SCANIA-2D X-ray Emission spectrometer during commissioning beamtime 2019-12-11.
Emission lines
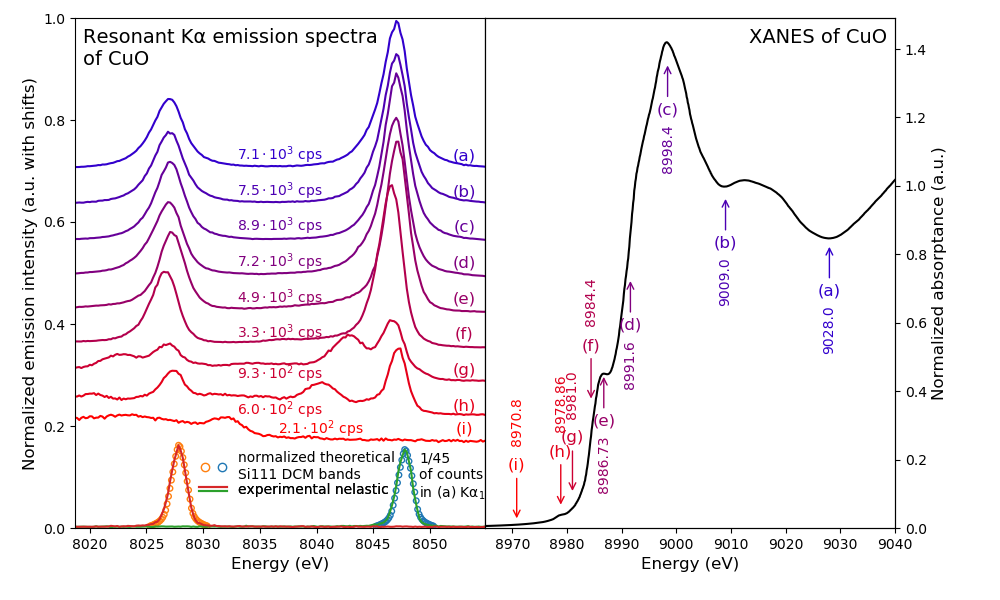
XANES and resonant XES spectra of CuO. The XES spectra were measured at 9 excitation energies marked on the XANES spectrum. The count rates refer to the total sum of counts in the full energy range of XES. The XES spectrometer was also qualified by analyzing elastically scattered light at the excitation energies 8027.83 and 8047.78 eV – tabulated energies of the Cu Kα2 and Cu Kα1 lines [xdb.lbl.gov], see the lower left part of the Figure. The XES spectrometer had one Si444 Johansson-type crystal analyzer. The XANES spectrum was measured in transmission on the same pressed pellet.
HERFD XANES
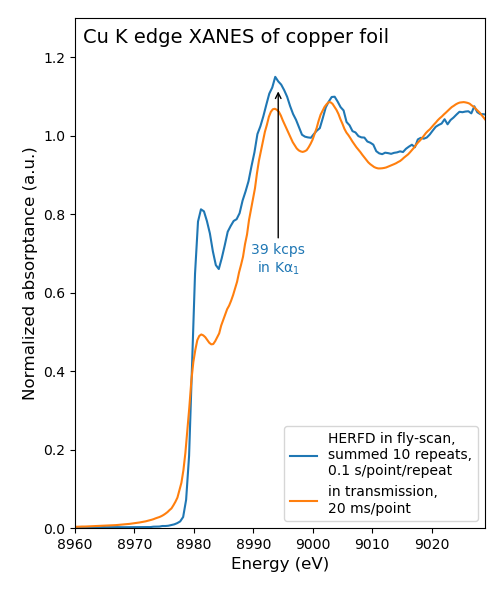
Conventional XANES and High Energy Resolution Fluorescence Detected (HERFD) XANES of copper foil. Both spectra were measured in the fly scanning mode, with the latter one being a sum of 10 repeats.
Full spectrometer branch (3 crystals)
New data collected in July 2022 in collaboration with expert commissioning users.
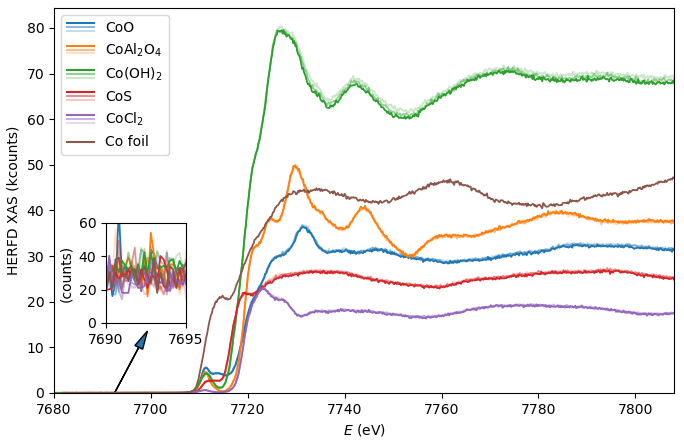
The Co Ka1 HERFD spectra were collected together with expert commissioning users (A. Jentys group from TU Munich) in July 2022. A full spectrometer branch (3 crystals) was used for the first time. Here, the scanning range had 650 points (rather excessive) at 0.5 sec per point. Note the noise level in the inset plot that would remain much smaller than signal with a sample dilution down to 1wt%.
This website uses cookies to improve your experience while you navigate through the website. Out of these, the cookies that are categorized as necessary are stored on your browser as they are essential for the working of basic functionalities of the website. We also use third-party cookies that help us analyze and understand how you use this website. These cookies will be stored in your browser only with your consent. You also have the option to opt-out of these cookies. But opting out of some of these cookies may affect your browsing experience.
Necessary cookies are absolutely essential for the website to function properly. These cookies ensure basic functionalities and security features of the website, anonymously.
Cookie
Duration
Description
cookielawinfo-checkbox-analytics
11 months
This cookie is set by GDPR Cookie Consent plugin. The cookie is used to store the user consent for the cookies in the category "Analytics".
cookielawinfo-checkbox-functional
11 months
The cookie is set by GDPR cookie consent to record the user consent for the cookies in the category "Functional".
cookielawinfo-checkbox-necessary
11 months
This cookie is set by GDPR Cookie Consent plugin. The cookies is used to store the user consent for the cookies in the category "Necessary".
cookielawinfo-checkbox-others
11 months
This cookie is set by GDPR Cookie Consent plugin. The cookie is used to store the user consent for the cookies in the category "Other.
cookielawinfo-checkbox-performance
11 months
This cookie is set by GDPR Cookie Consent plugin. The cookie is used to store the user consent for the cookies in the category "Performance".
viewed_cookie_policy
11 months
The cookie is set by the GDPR Cookie Consent plugin and is used to store whether or not user has consented to the use of cookies. It does not store any personal data.
Functional cookies help to perform certain functionalities like sharing the content of the website on social media platforms, collect feedbacks, and other third-party features.
Performance cookies are used to understand and analyze the key performance indexes of the website which helps in delivering a better user experience for the visitors.
Analytical cookies are used to understand how visitors interact with the website. These cookies help provide information on metrics the number of visitors, bounce rate, traffic source, etc.
Advertisement cookies are used to provide visitors with relevant ads and marketing campaigns. These cookies track visitors across websites and collect information to provide customized ads.