EXI provides a web interface to the data collection logs and the results from automated data processing pipelines launched after a data collection is complete. A plot showing the number of spots and resolution per image appears soon after data collection is completed. EDNA and fastdp usually run in a matter of minutes and are useful to provide fast feedback about data quality. The DIALS and AutoPROC pipelines take typically longer to run and may give improved results. In the presence of an anomalous signal, SAD phasing is also attempted by default using the fast_ep pipeline, and EXI includes a link to the results.
To access these records, log in to EXI and select you current proposal number. Click on the following links for directions to inspect the processing results.
When you log in to EXI and select a proposal you will be directed to the table of sessions for that proposal. By default, they will be ordered in inverse order of creation, i.e. the most recent session will be listed first. If you want to see the sessions for all your proposals on a given date or a time interval, use the Choose a date or Choose a period of time buttons. Once you locate the desired session, click on the date to access all the data collections in the session.
Note: Refresh the browser page in order to update the result list during data collection.
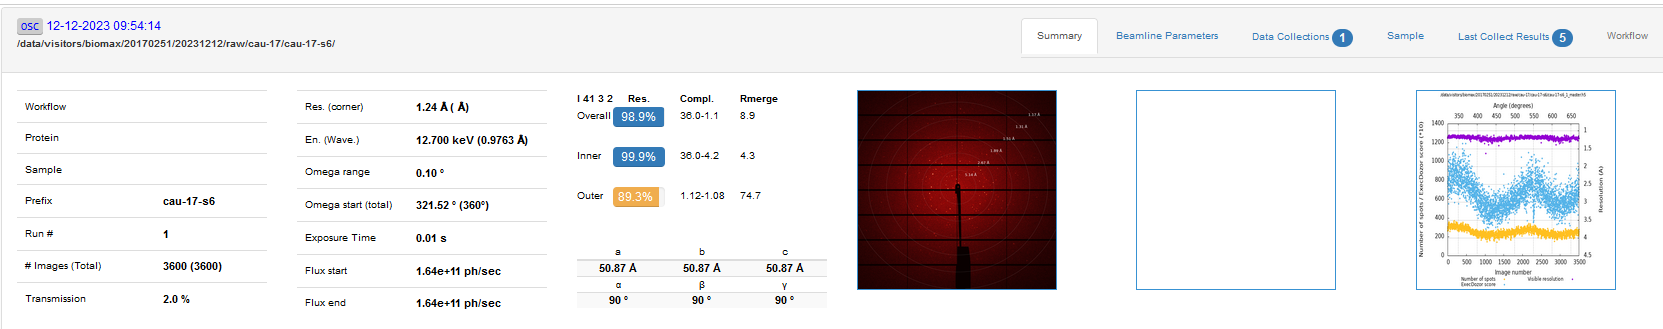
- The data collection results are displayed, by default, in the List view, in inverse order of creation. The list view shows a brief summary of the experiment parameters, a summary of the autoprocessing results, an image snapshot (the image will be weak for small oscillation images) a crystal snapshot (if they have been collected) and a plot showing the number of spots, estimated resolution and a score calculated with the program Dozor for each of the images of the data set. This plot can be used to detect problems during data collection, such as poor sample alignment and strong radiation damage.
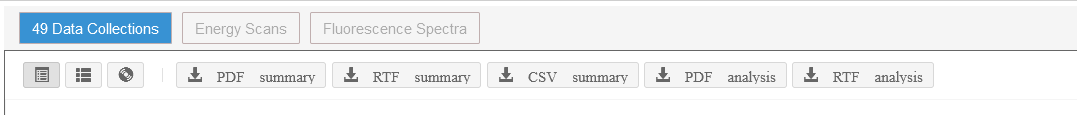
- You can also using the icons at the top left of the screen to display the data collection lists in different formats. If you have collected energy scans or fluorescence scans as part of the experiment, use the corresponding tabs to see the results of the scan analysis.
- To the right of the default of the Data collection list view is the Summary view, using a more condensed format.
- The third icon, Container view, displays the unipucks in the session and allows to select samples based on their port number.
- The PDF and RTF summaries provide the same information as the data collection List view, in a downloadable file.
- The CSV summary direct to a spreadsheet with the data collection parameters (eg. detector to sample distance, wavelength, number of images, etc.) for each sample.
- The PDF and RTF analysis contain a summary of the autoprocessing results.
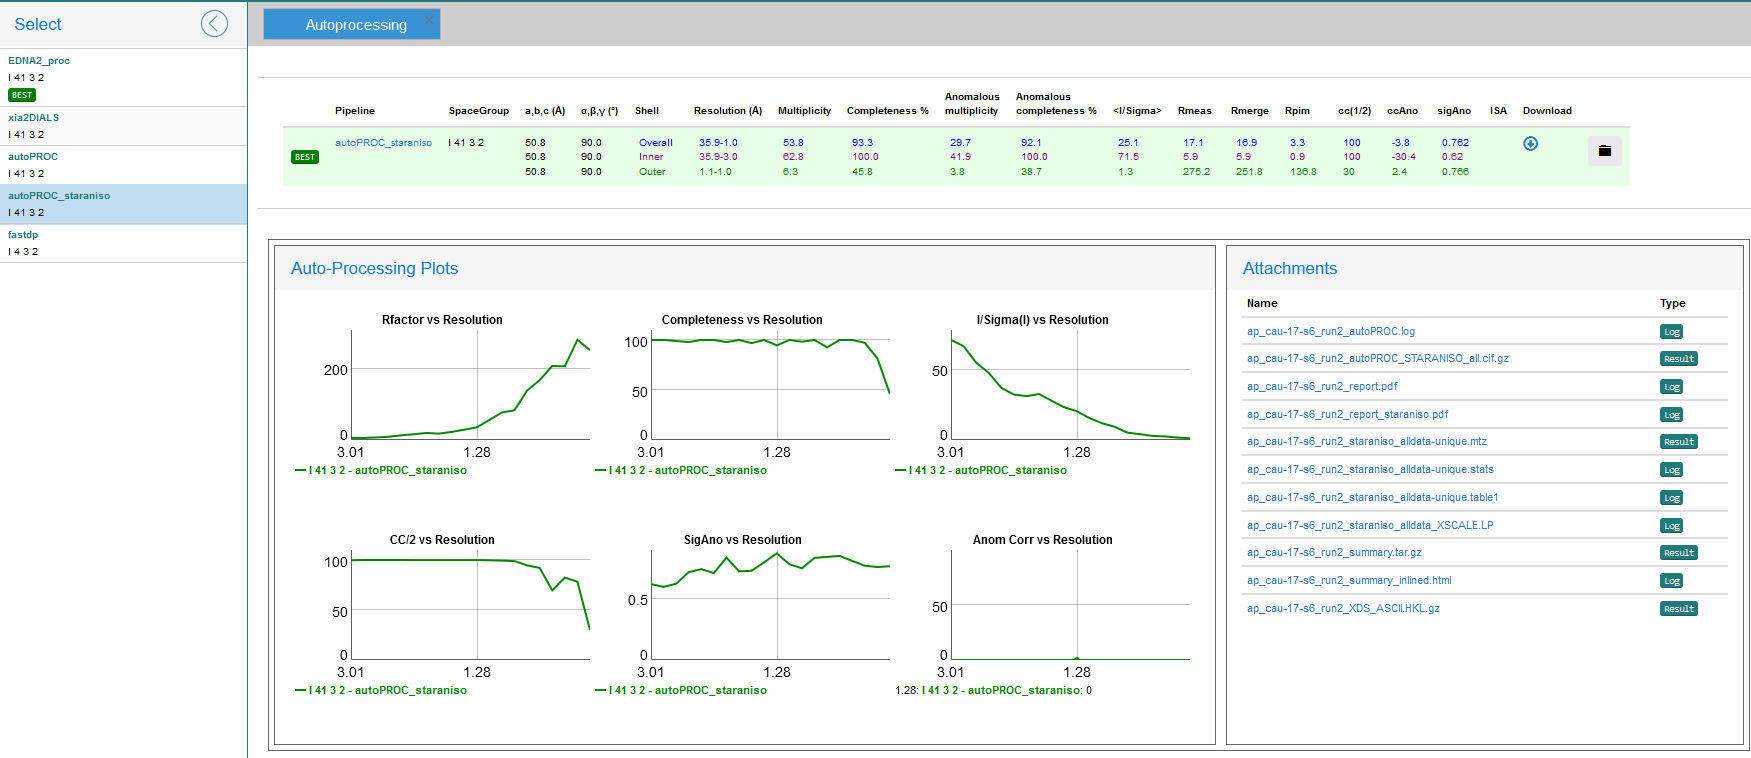
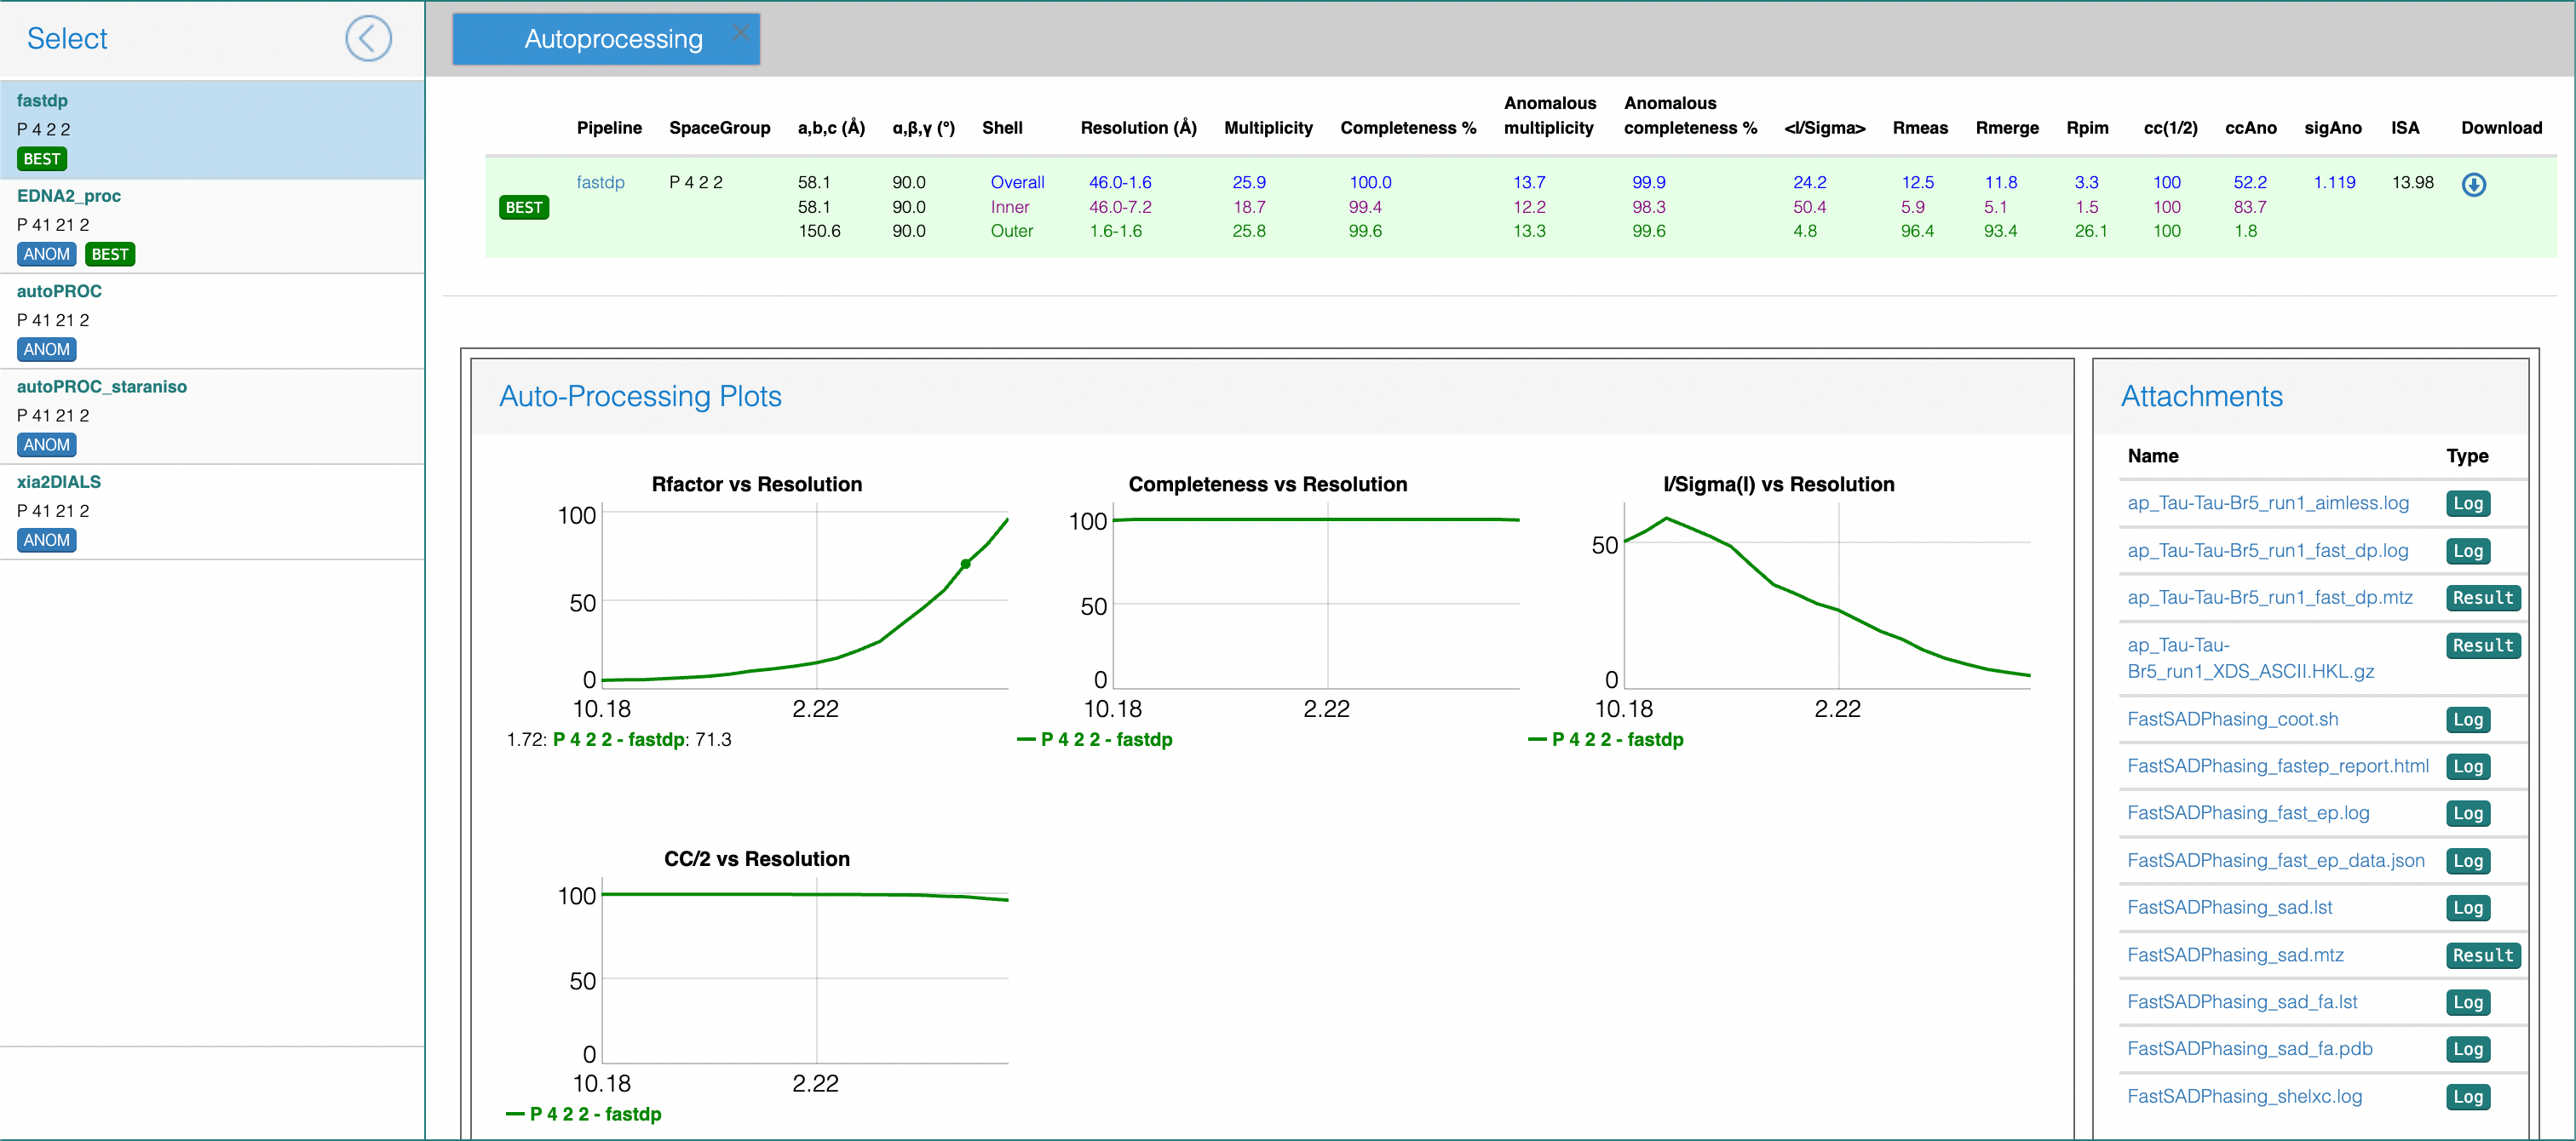
- For a given collection you can click on the Beamline parameters, Data collection or Sample buttons to see additional detailed information on the experimental parameters and beamline status during data collection. To look at the autoprocessing results, click on Last collect results. This shows a summary of the processing results for different pipelines. Typically, Friedel pairs are treated as symmetry equivalents for scaling purposes, unless a strong anomalous signal is detected in the data. In this case the entries for the results will have the “ANOM” tag.
- Clicking on the name of the pipeline will access some plots and log and results files generated during data processing. You can click on the files to display the contents or, if you are browsing from your own computer, you can also download the files as a zip archive.
- If a significant anomalous difference is detected between Friedel pairs, experimental phasing is attempted. In this case, the fast_dp results will also contain links to the phasing results from fast_ep.
Note: The data processing results are displayed on a different browser tab. To go back to the data collection list, return to the original tab.
If you would like to look at the results on disk, change the directory to /data/visitors/biomax/’proposal’/’date’ or /data/proprietary/biomax/’proposal’/’date’ (for proprietary proposals) . This directory should be visible to any person listed in the proposal from any beamline computer or data processing HPC cluster. Under there, go to the process subdirectory. From there, you can inspect the relevant subdirectories for the protein and crystal data group. The results are stored under the directories of the form xds_’crystal_’protein’_’run’_’point’ and are grouped by pipeline. If there are no results, look at the EDNA_’pid’.err file (it is always named EDNA regardless of the pipeline) to see the error. If in doubt what the error means, consult with the beamline staff.
Note that, even if the autoprocessing results look acceptable, you may be able to get even better results if you process the data manually either at home or MAX IV. You have “write” permission in the process subdirectory, so you can create folders to store manual data processing results – Note that the writing permission does not extend to the folders created by the autoprocessing pipelines. You will not be able to modify those!.
The XDS.INP file that can be found in each process subdirectory for each data set is a good starting point to rerun XDS with the same or different options, but it may be easier to use the PReSTO environment to reprocess the data from scratch. Please see the documentation on manual data reduction for more help on this topic.