The analysis chamber hosts a VT XA STM (ScientaOmicron). The microscope has recently (2019) been upgraded so that non-contact AFM via QPlus sensors became possible. Most of our users run perform STM characterization of their samples in conjunction with their (spectrocopy) studies at other beamlines. Using vacuum suitcase at SPM lab it is possible to transfer the samples to/from STM from/to most of the beamlines at 1.5 GeV ring and HiPPiE at 3 GeV ring without breaking the ultra-high vacuum conditions.
Analysis chamber specifications
| Base pressure | 7×10-11 mbar |
| Sample heating | Yes, up to ~ 370o C / 650 K via boraelectric heater, Lakeshore controller Scanning at elevated temperature possible |
| Sample cooling | Yes, down to -163o C / 110 K via LN2 bath cryostat ~ 12 hours stable operation at 110 K per one cryostat filling |
| Ports for atom/molecular sources | DN40CF × 2 if long-distance microscope is not needed Imaging during deposition is possible Approx distance flange-sample ~ 160 mm at 40o incidence |
| Storage | Carousel with 12* sample slots |
*Actual number of available slots is normally less than that because some slots are occupied with a tip carrier, few tips/QPlus sensors, test samples, etc. More storage may be available upon a timely request.
Microscope specifications
| Coarse tip positioning range, mm | ~ 10 × 10 × 5 |
| Fine positioning/scanning range, μm | ~ 19 × 19 (12 × 12) |
| Max / min sample temperature, oC (K) | ~ 370 (650) / -163 (110) |
| Tip cooling / cryo-STM | No |
| Imaging at arbitrary temperature | Yes |
| Lockin amplifier | SRS830 |
| Techniques available | STM, STS, dI/dV mapping, ncAFM**, dF/dV (~KPFM) and dF/dZ mapping |
** Due to poor control over the tip shape at room temperature, the performance of all ncAFM techniques is not guaranteed.
Resolution in STM and ncAFM
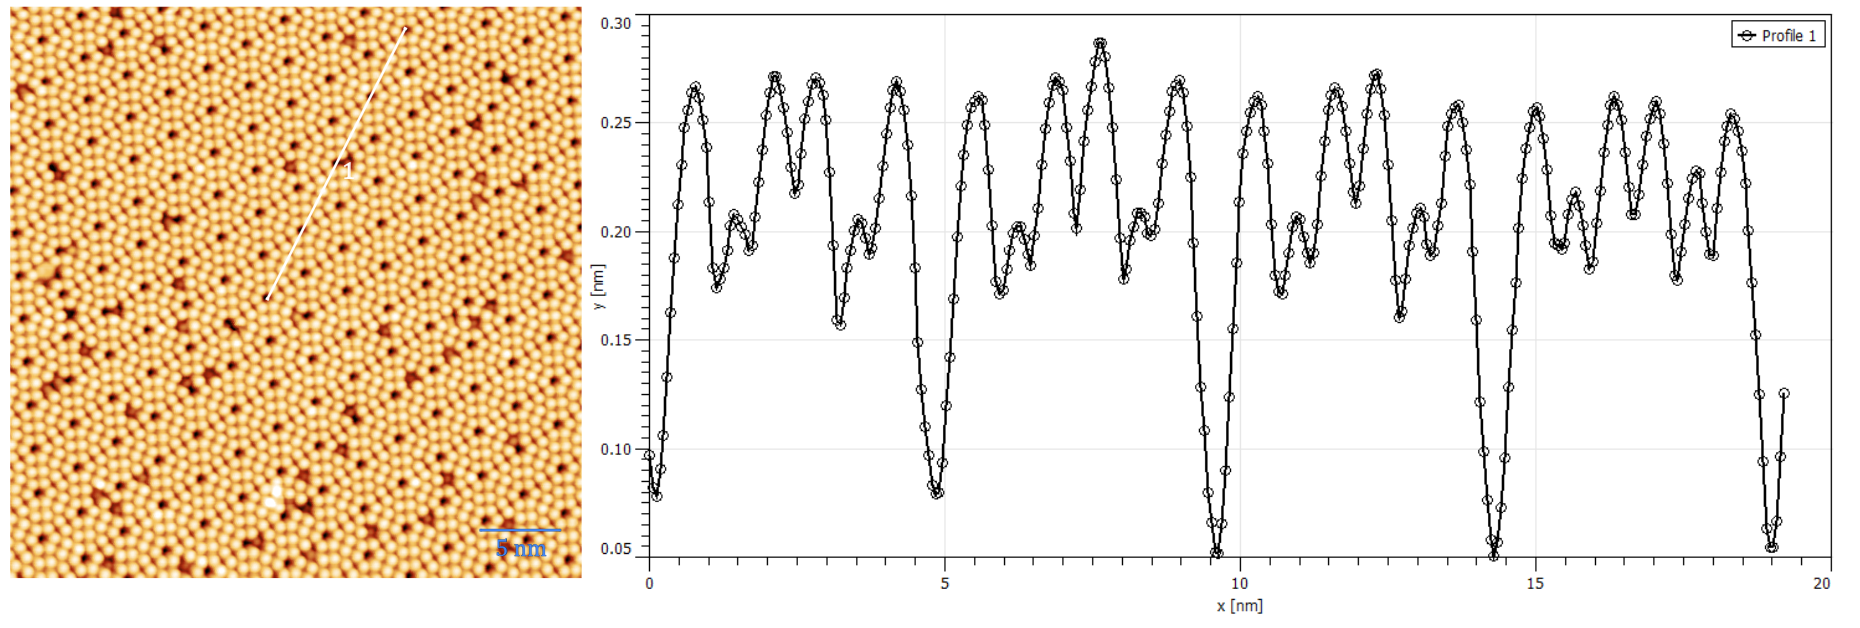
STM
Si(111)-(7×7) tunneling conditions Vbias = +1.55 V, It = 130 pA
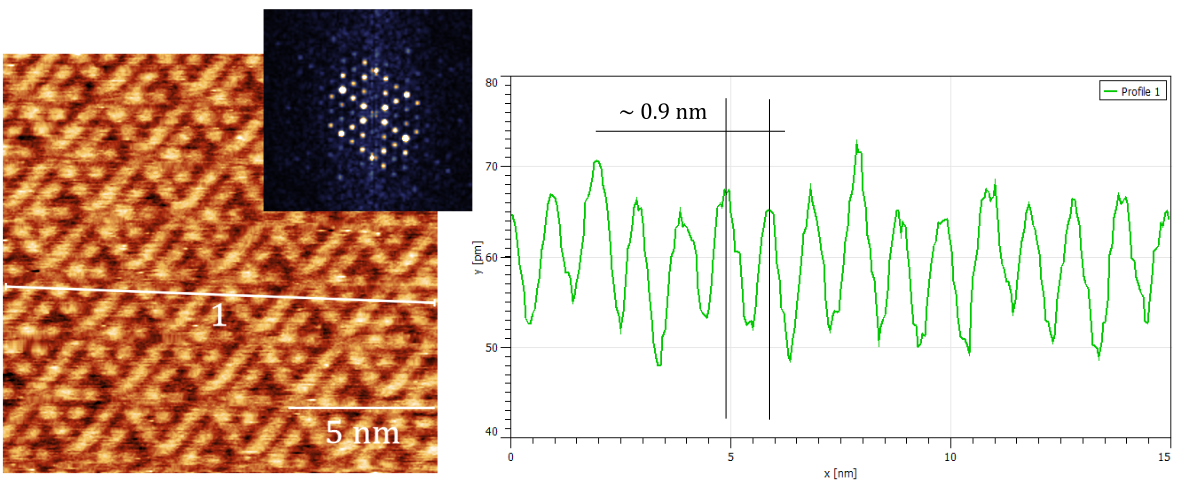
AFM
Si(111)-(7×7) scanning conditions: Vbias = 0.00 V, df = -27.1 Hz (f = 28.04 kHz)
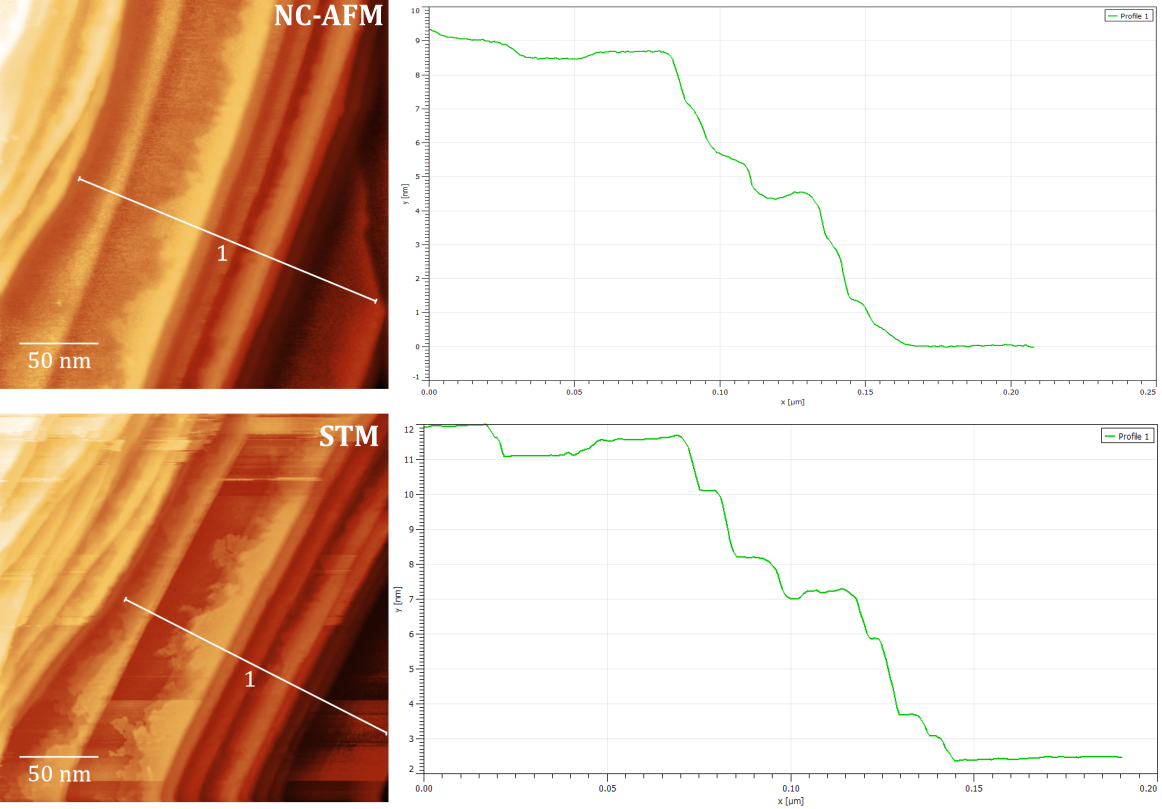
Comparison between STM and ncAFM imaging/resolution
Sample: SiC(0001), STM: Vbias = +1.25 V, It = 230 pA AFM: Vbias = 0.00 V, df = -20.1 Hz (f = 28.04 kHz)