XRF data
Example of an XRF map from Balder using the 7 element Ge detector. The sample was a cross-section of a seed fern on a microscopic glass slide (25 x75 mm). The yellow dashed rectangle marks the mapped area. Elemental maps of Ca, Fe and Zn.
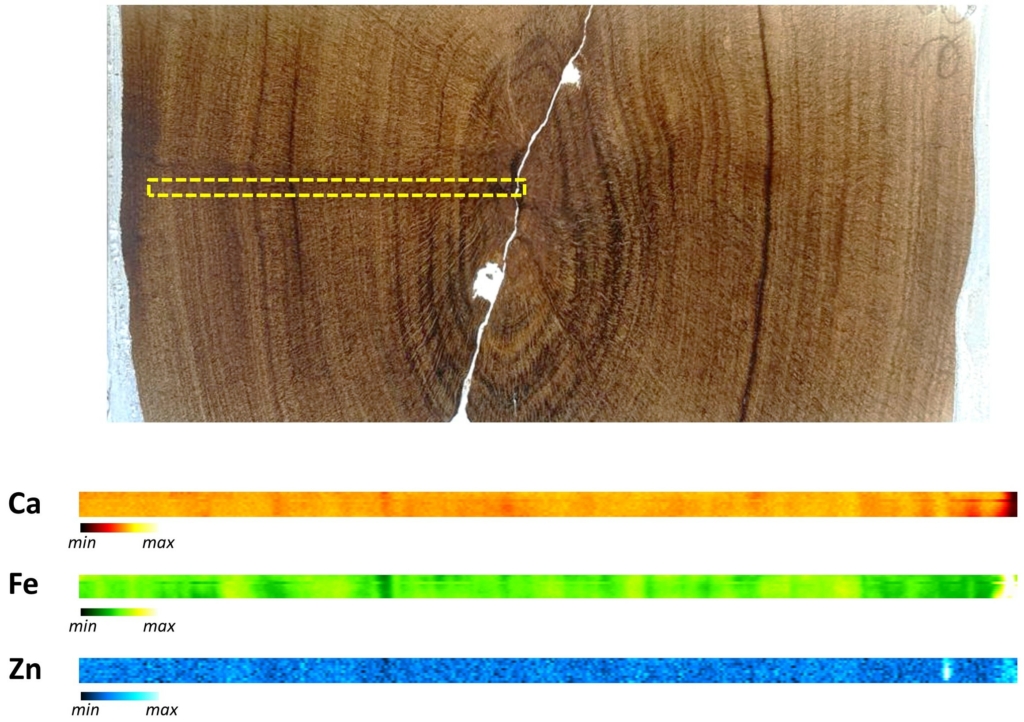
Settings: Excitation 12 keV, Spot size 100×100 µm, Dwell time 1 sec, Time for full map 115 min.
Example with live XRF mapping viewer
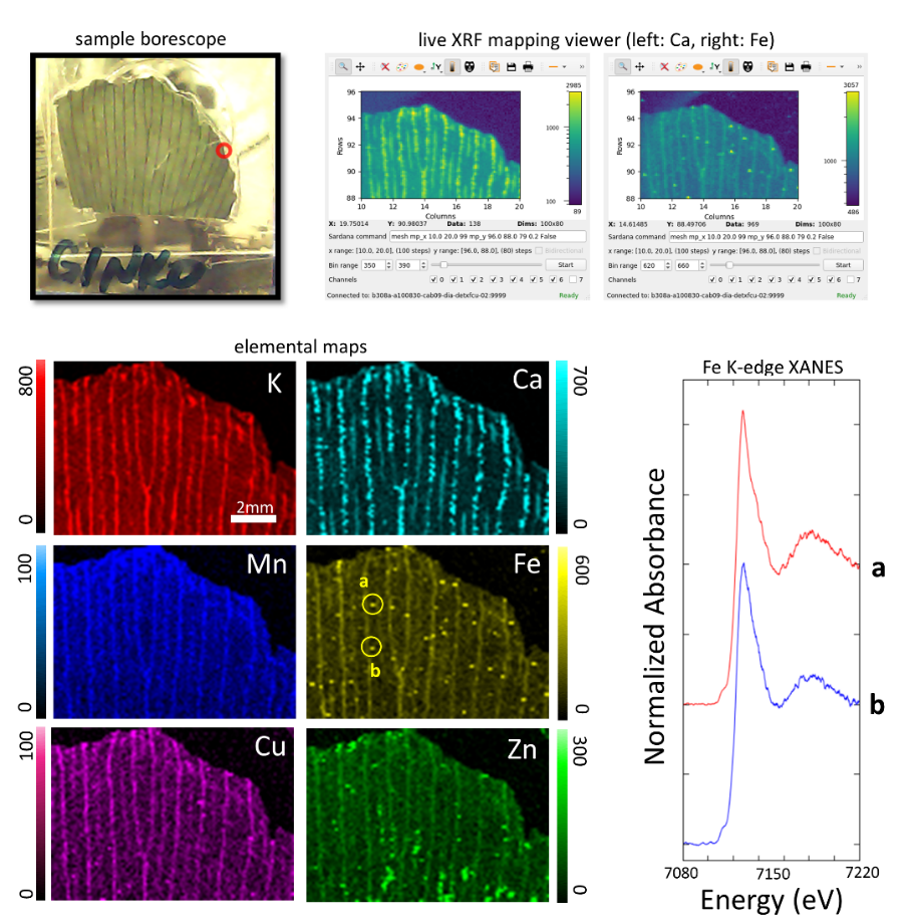
Features of XRF mapping and spot-XANES data collection. Sample borescope (upper left) is used to set up initial scanning coordinates. The live XRF mapping viewer (upper right) displays user-defined binned elements. Elemental maps shown are of Ginkgo leaf mapped with 100 µm steps. XANES data collected following XRF mapping. Sample coordinate positions of ensuing scans can be read in the live viewer when hovering over the pixels.
XHyView – XAS hyperspectral viewer
XANES mapping based on energy scanning with energy dispersive detectors, i.e. in each x/y coordinate an energy spectrum (XANES) is recorded and at the same time in each energy position a full MCA spectrum (XRF) is recorded. This gives a multidimensional data set that the in house software XHyView (S. Ansell) can view and extract data (XANES, XRF, 2D maps, depth profiles) and correlations from.
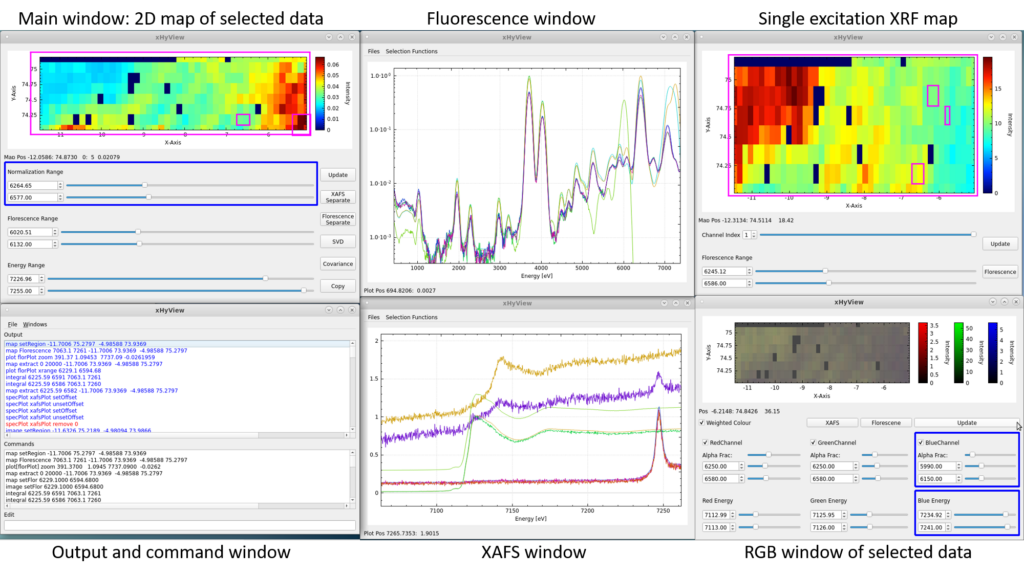
This was a 6.5 x 1.25 mm2 map of a fossil, x/y step of 0.14 mm, 414 spatial positions. Energy scan set up in every x/y coordinate: 1) single excitation 6 keV 1 second, 2) Fe K-edge XANES (7.06-7.26 keV) 50 seconds, 3) single excitation 10 keV 1 second. This gave 1002 energy positions.