The HIPPIE beamline offers time-resolved APXPS and IRRAS with chemical perturbation using pressure or temperature pulses. Please get in touch with the beamline team for further details of the setup or if you want to apply for the beamtime with this instrument.
Gas Pulsing
The gas composition can be modulated by controlling the MFCs or using cell internal solenoid valves. A square or sine pressure waves can be created for two gases dosed independently through two dosing lines.
| MFCs | Solenoid Valves | |
|---|---|---|
| Type | Brooks (flow rates: 0.5 – 30 sccm) | Staiger VA204 |
| Typical pressure range | 0.1-5 mbar | 0.1 – 2 mbar |
| Typical period | 1 – 2 min | seconds |
| Typical gas exchange ratio | 1:10 | 1:1000 |
| Width of the gas pulse rising edge | > 1 s | 0.1 s |
| Type of synchronization | free-running, pump-probe | pump-probe |
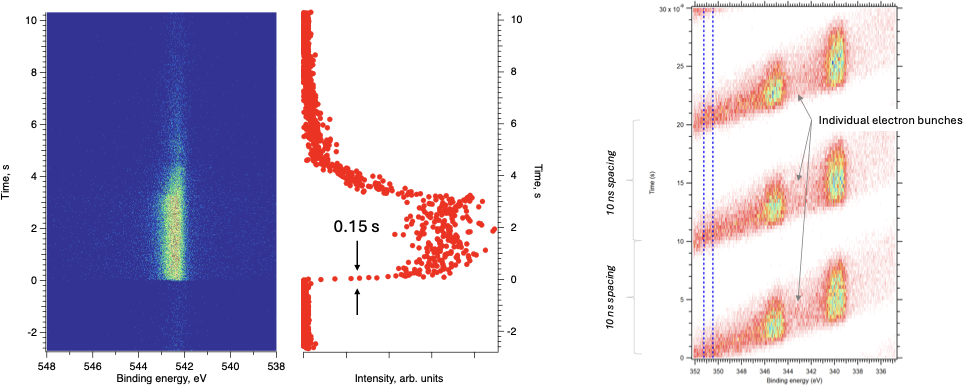
The left panel in the figure below shows an O1s 2D time map of CO2 gas pulses using the built-in solenoid valve. The operation of the valves is synchronized with the delayline detector (DLD). Time zero corresponds to the moment the valve opens. The middle panel shows the time profile of the pulse. Note the 0.15s rising edge time! The right panel shows Pd 3D 2D time map obtained from Pd crystal with the DLD synchronised with the ring electron bunches. Note the 10 ns spacing between the Pd spectra originating from individual bunches.
Temperature ramping
The temperature pulsing/ramping is achieved using the HT cell’s standard IR laser heater. Ramps up to 10 deg/s can be achieved.
Time-resolved Photoemission
Detector: Delayline Detector (DLD)
Software: PEAK
Maximum time resolution: ~ 1 ns (defined by the ring bunch length)
Time-resolved IRRAS
Detector: D31x/B-A MCT detector
Software: Opus 10
Maximum acquisition rate: 75 Hz
Data Analysis
- Event averaging with external synchronization (pump-probe-probe)
See the gas pulsing examples
- Event averaging with internal synchronization (image analysis). Check this paper for more details.
The image below shows the result of event averaging of 58 cycles during modulation of CO and O2 partial pressures. (A) O1s spectra measured during one period of modulation. (B) Examples of individual spectra from panel A. (C) O1s spectra averaged over 58 cycles using the image recognition algorithm demonstrated above. (D) Same spectra examples as in B, but event averaged. The clear improvement of the signal-to-noise ratio is apparent.

- Fourier Transform / Inverse Fourier Transform Analysis. Check this paper for more details
The Figure below demonstrates the principle of the FT/IFT analysis. For more details, check this paper.

The software for both types of analysis is available from the beamline upon request.
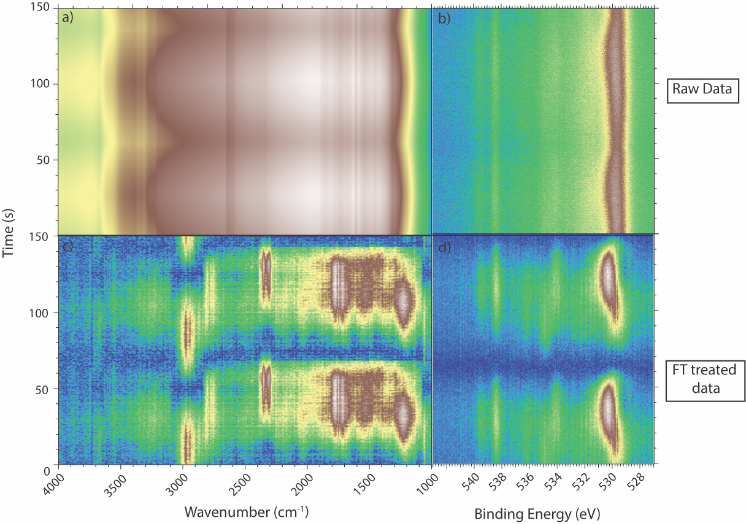
The Figure below shows the time-resolved IRRAS (a, c) and APXPS (b, d) (raw and FT processed, respectively) measured during methanol oxidation on Cu foil. During the experiment, the temperature of the catalyst was modulated with the IR laser between 350 and 550 °C using 40 s / 35 s heating/cooling periods, yielding a total period time of 75 s. Each measurement consists of ~10 oscillations. Two oscillations are presented in Figure below; however, the FT-treated data were calculated using the full data set of 10 oscillations. The IRRAS and APXPS datasets were recorded with 70 Hz and 10 Hz, respectively. In this system, the IRRAS data is dominated by the gas phase spectrum at the measurement point of the surface sensitive APXPS, giving information on both surface and gas chemical composition during thermal oscillations, the gas phase s driving the catalytic reaction. The FT-treated data only show the components of the spectra undergoing changes during the reaction.